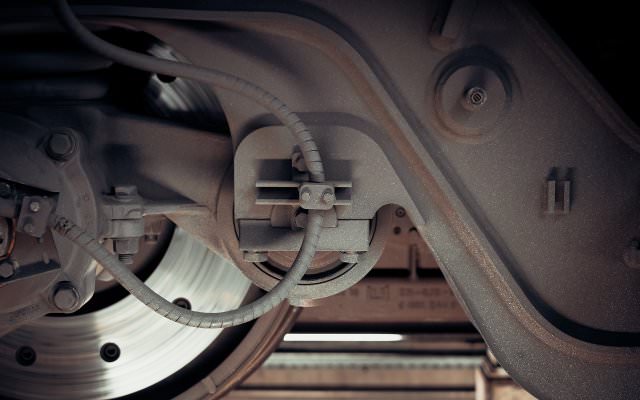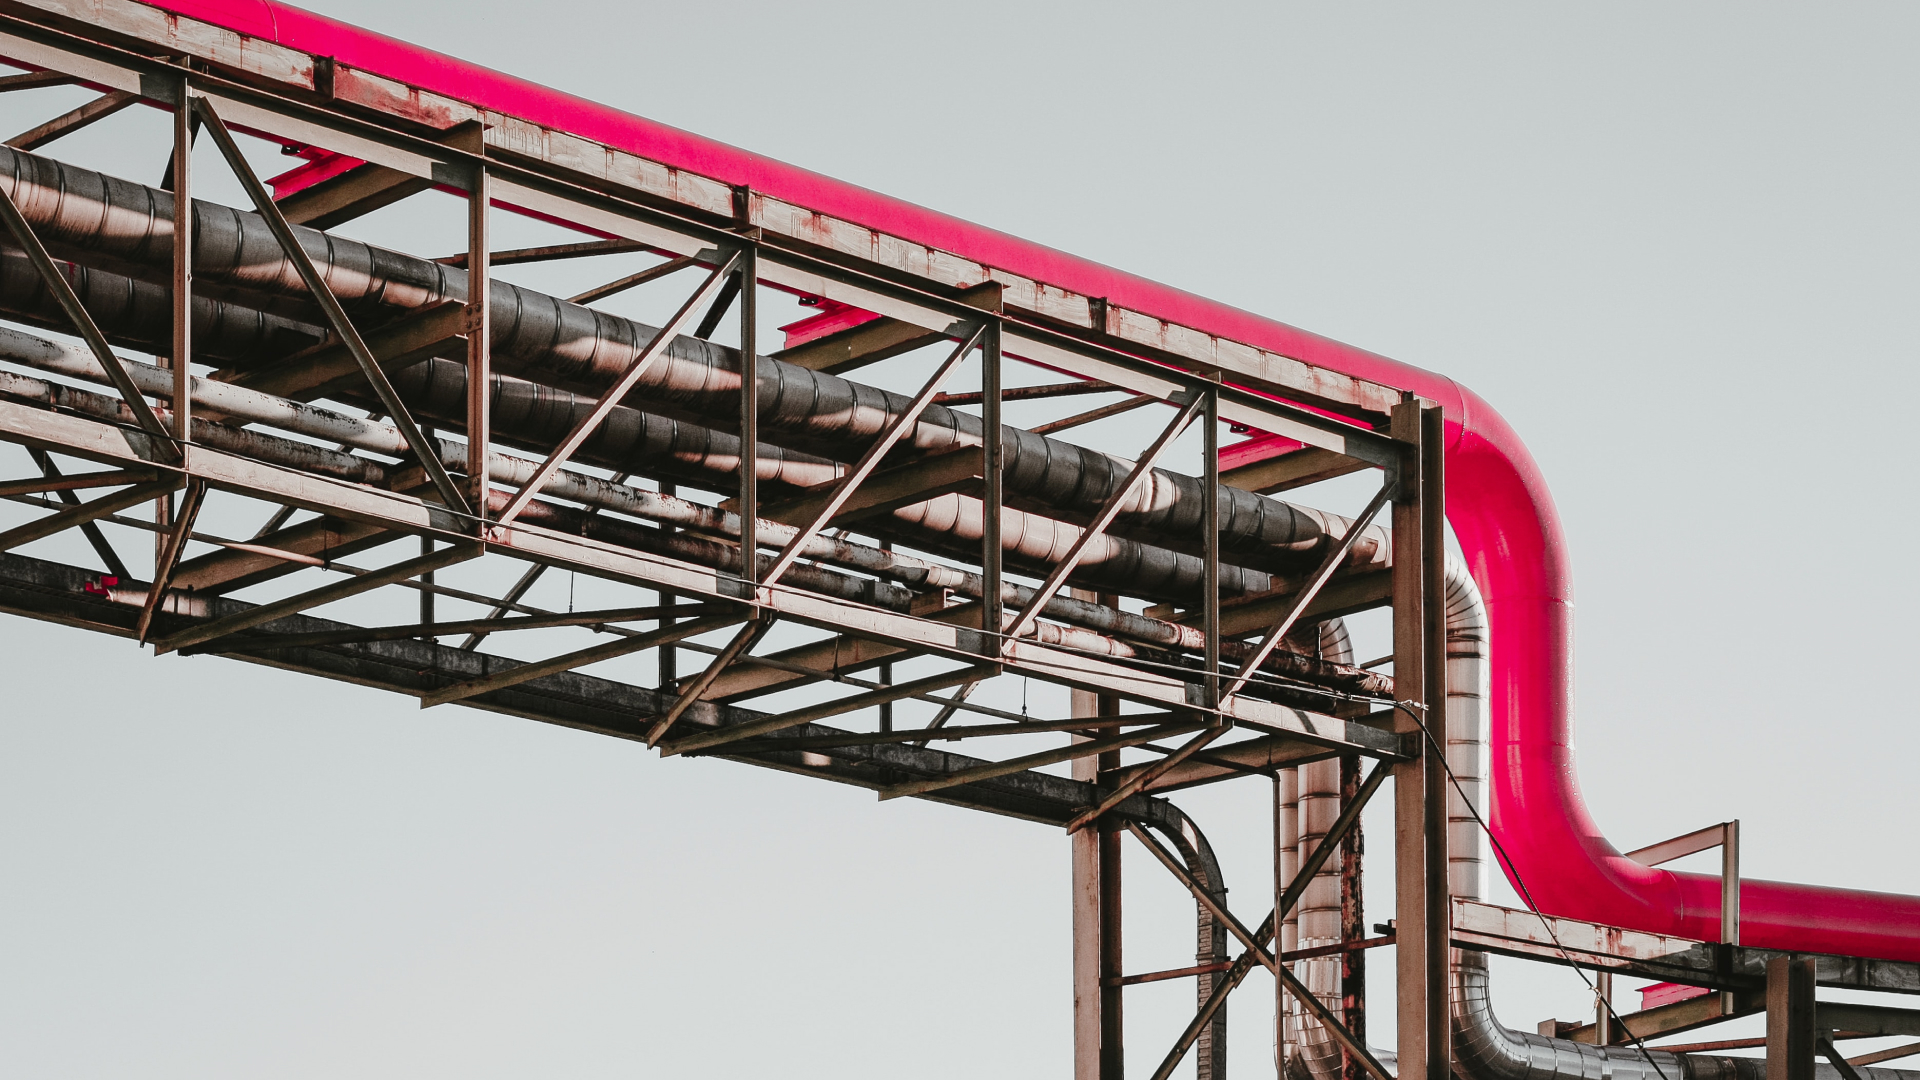
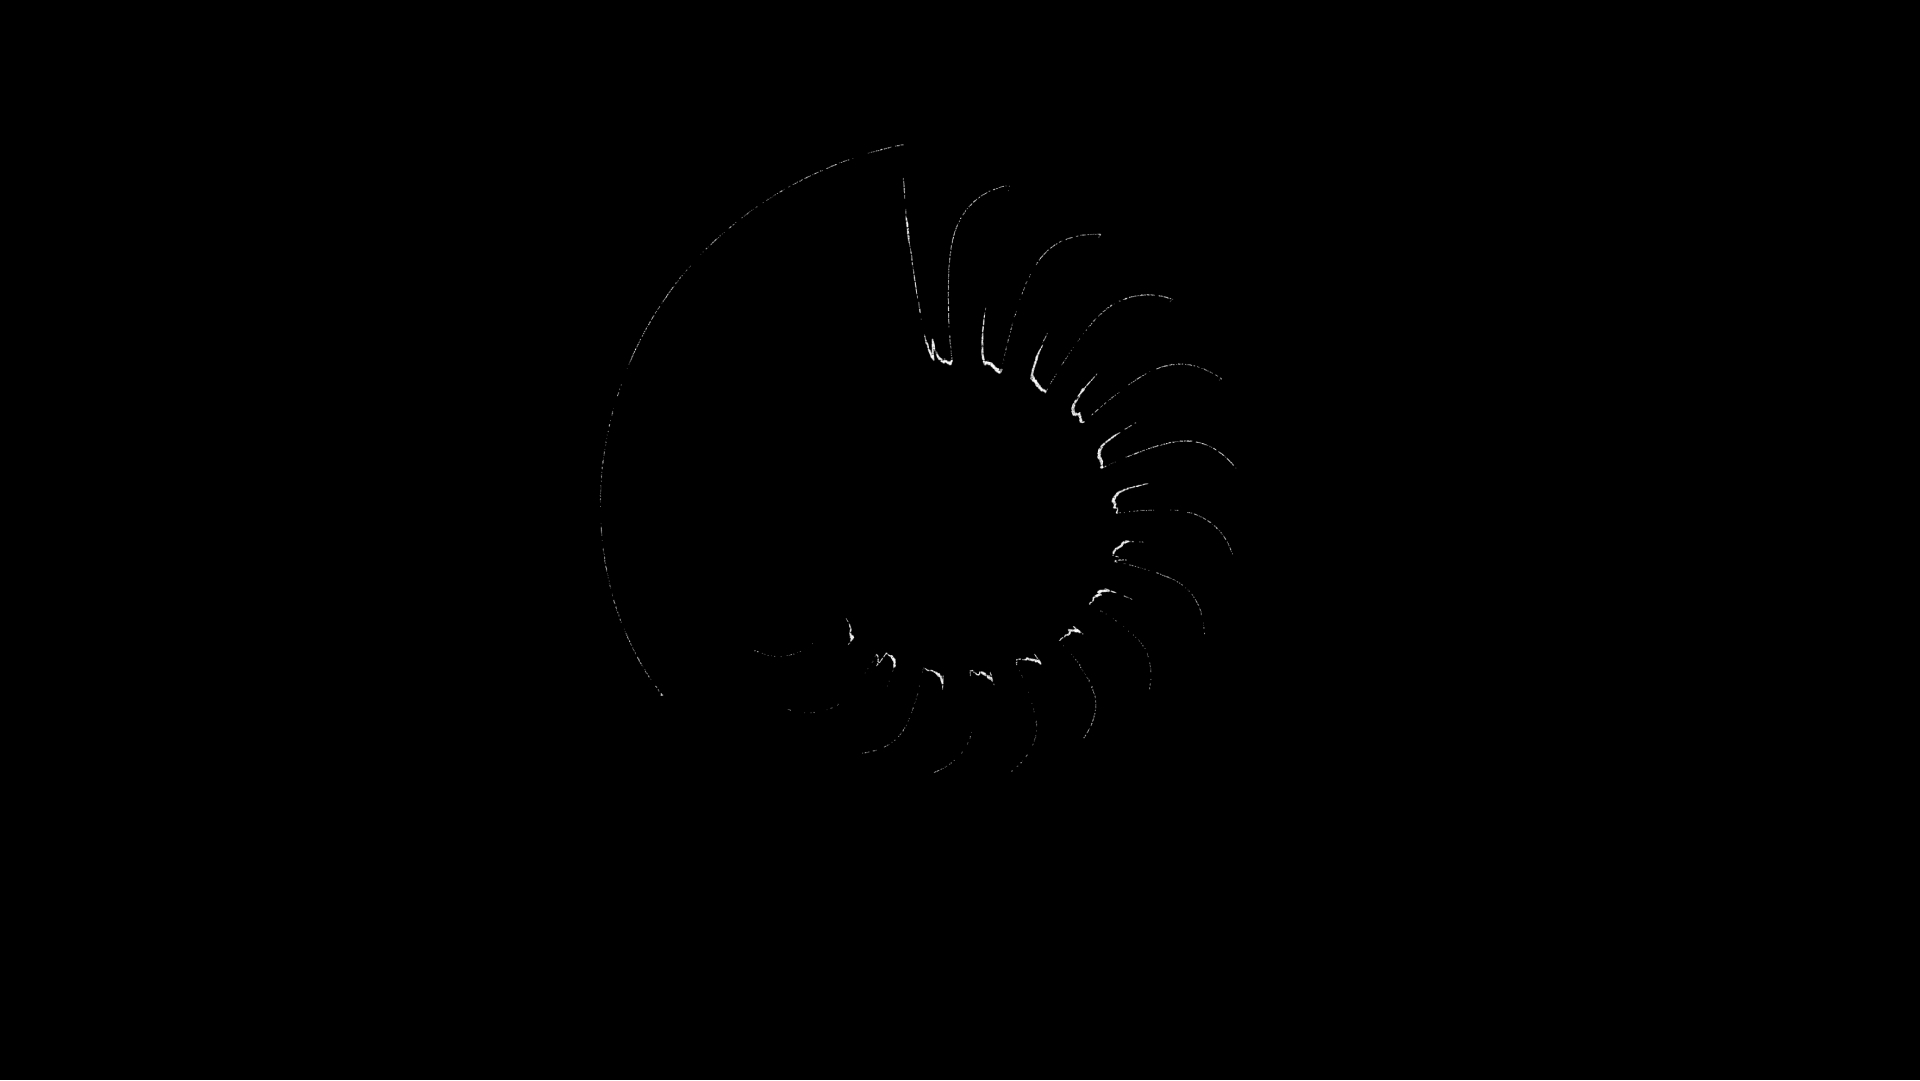
An OCR solution was implemented for one of the Canadian oil and gas companies. The implemented business process implies recognition of the charts which are generated by two or three pens driven by sensors attached to gas pipes. These pens plot traces on a rotating paper disk. As a result, the disc has the values of different parameters such as gas pressure, water, temperature. The next step is to convert this chart into a readable format.
This conversion process used to be performed manually by our customer’s employees. They had to manually delineate the contours of each trace using the mouse and then create the table with the values of the trace. Obviously, the whole process was very time-consuming and painful for the employee since he had no room for mistake. So, there was a need to build an OCR solution to automate this process.
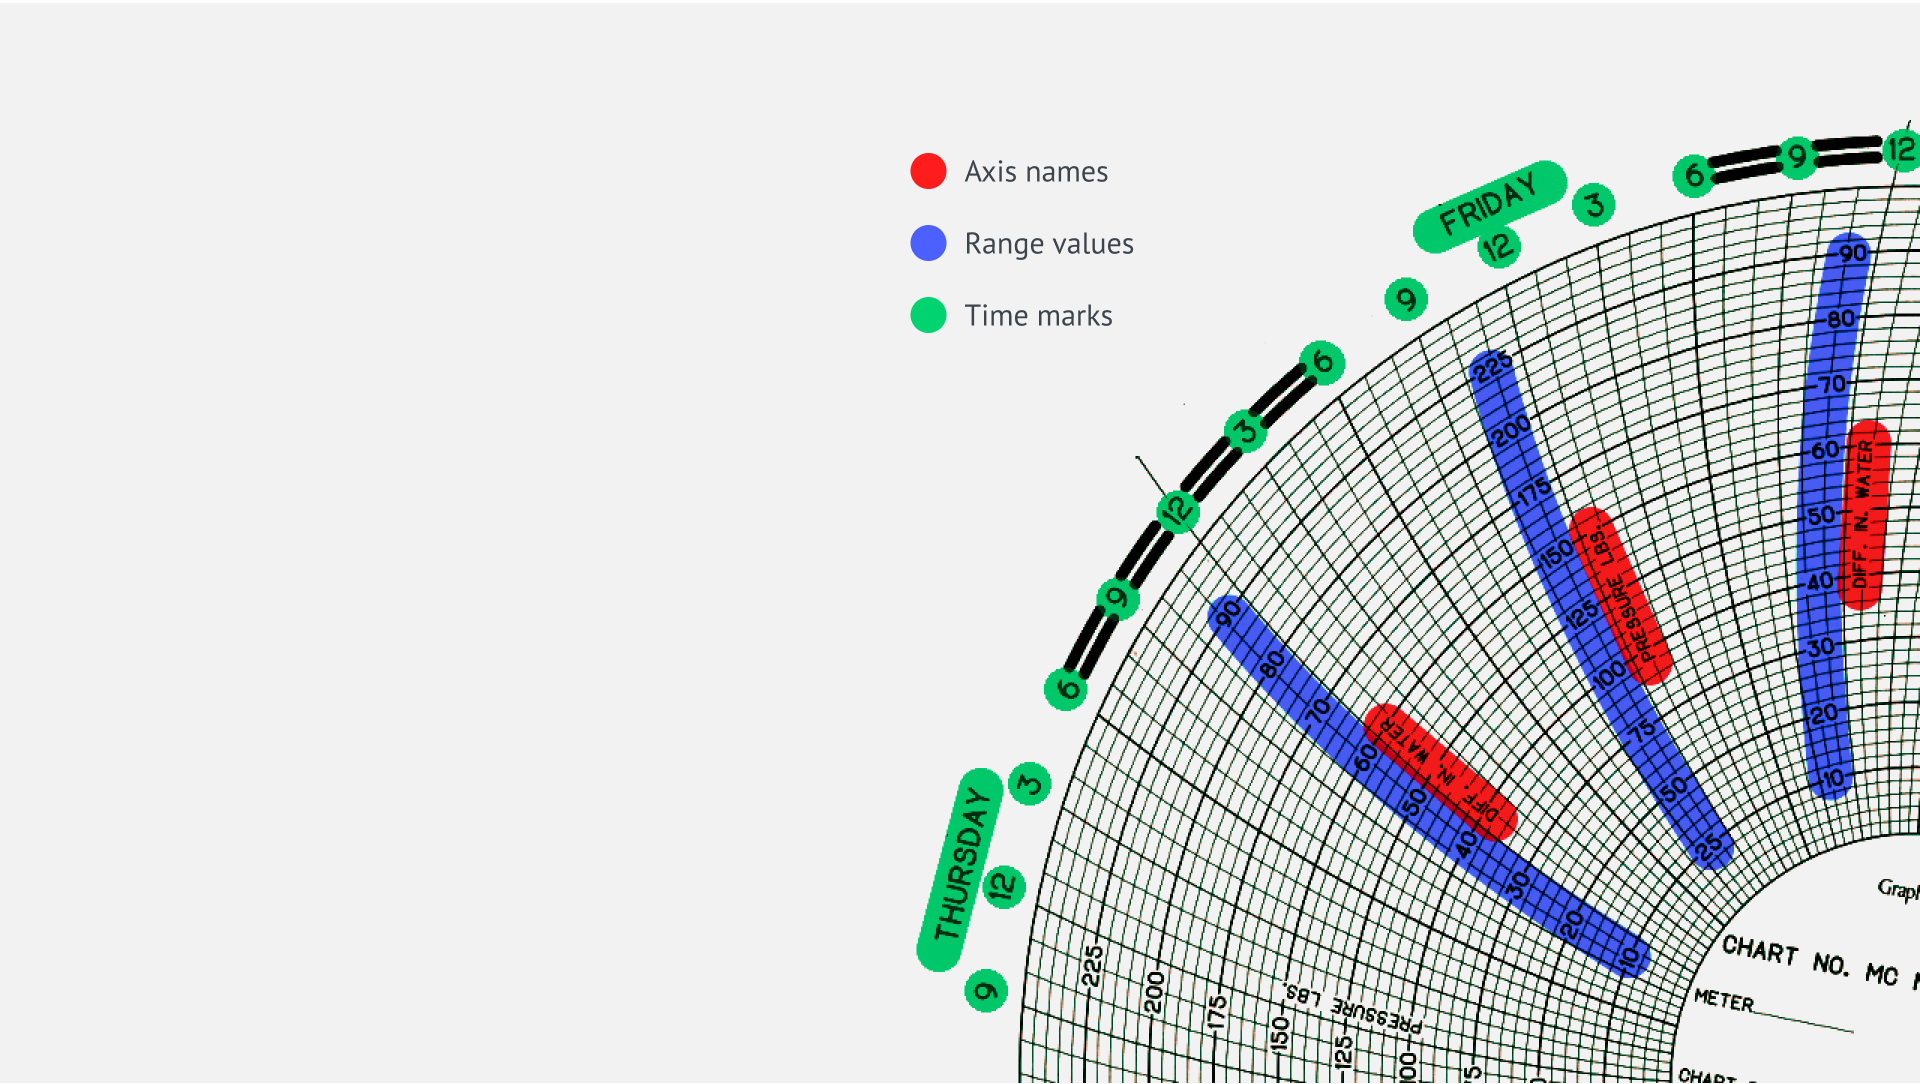
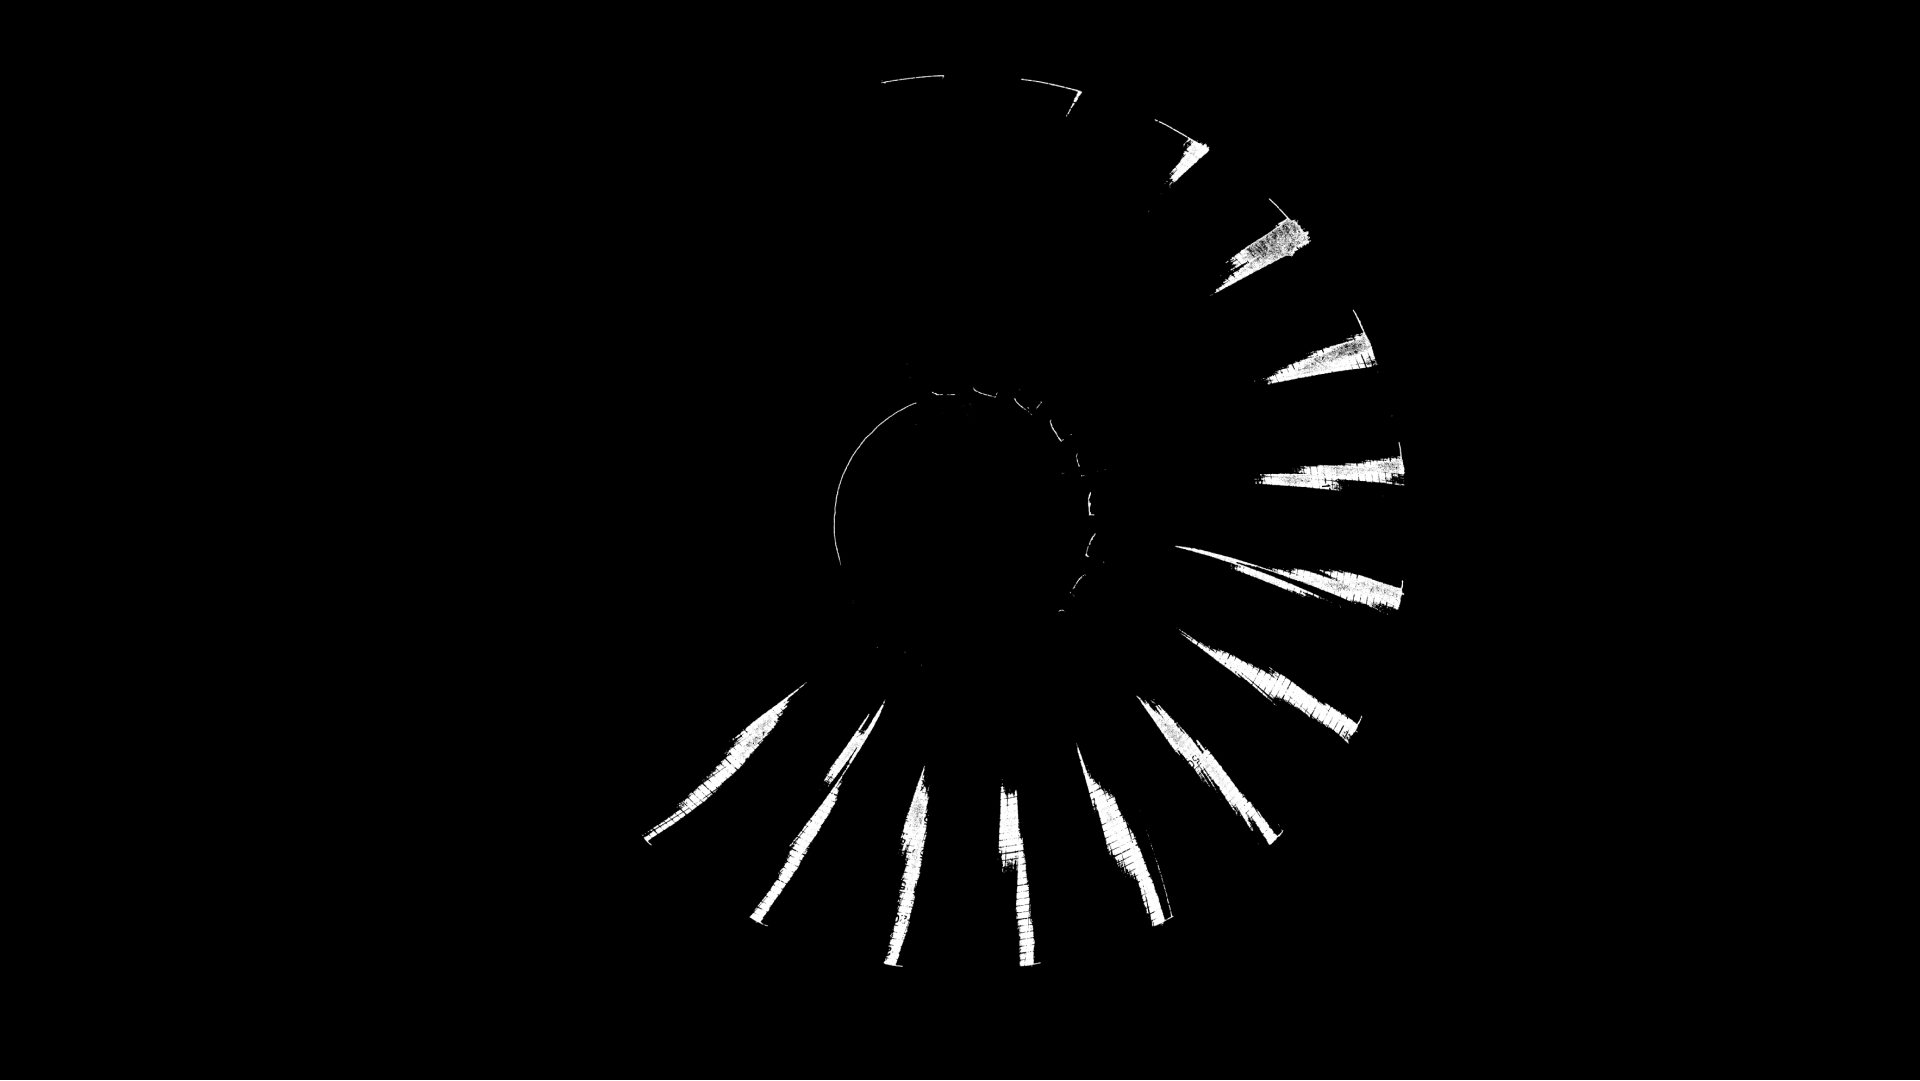
The main challenge we faced was how we actually should recognize the chart itself and all the traces it contains. The traces on the chart could hardly be seen or overlap each other.
These kinds of issues were the most challenging for us since we had to recognize each trace separately and form the table with the values of each parameter.
To solve the problems which were described above, we did step-by-step work. To be more specific, we implemented the following things:
To learn more about our approach to these challenges please see the article in our blog at the link.
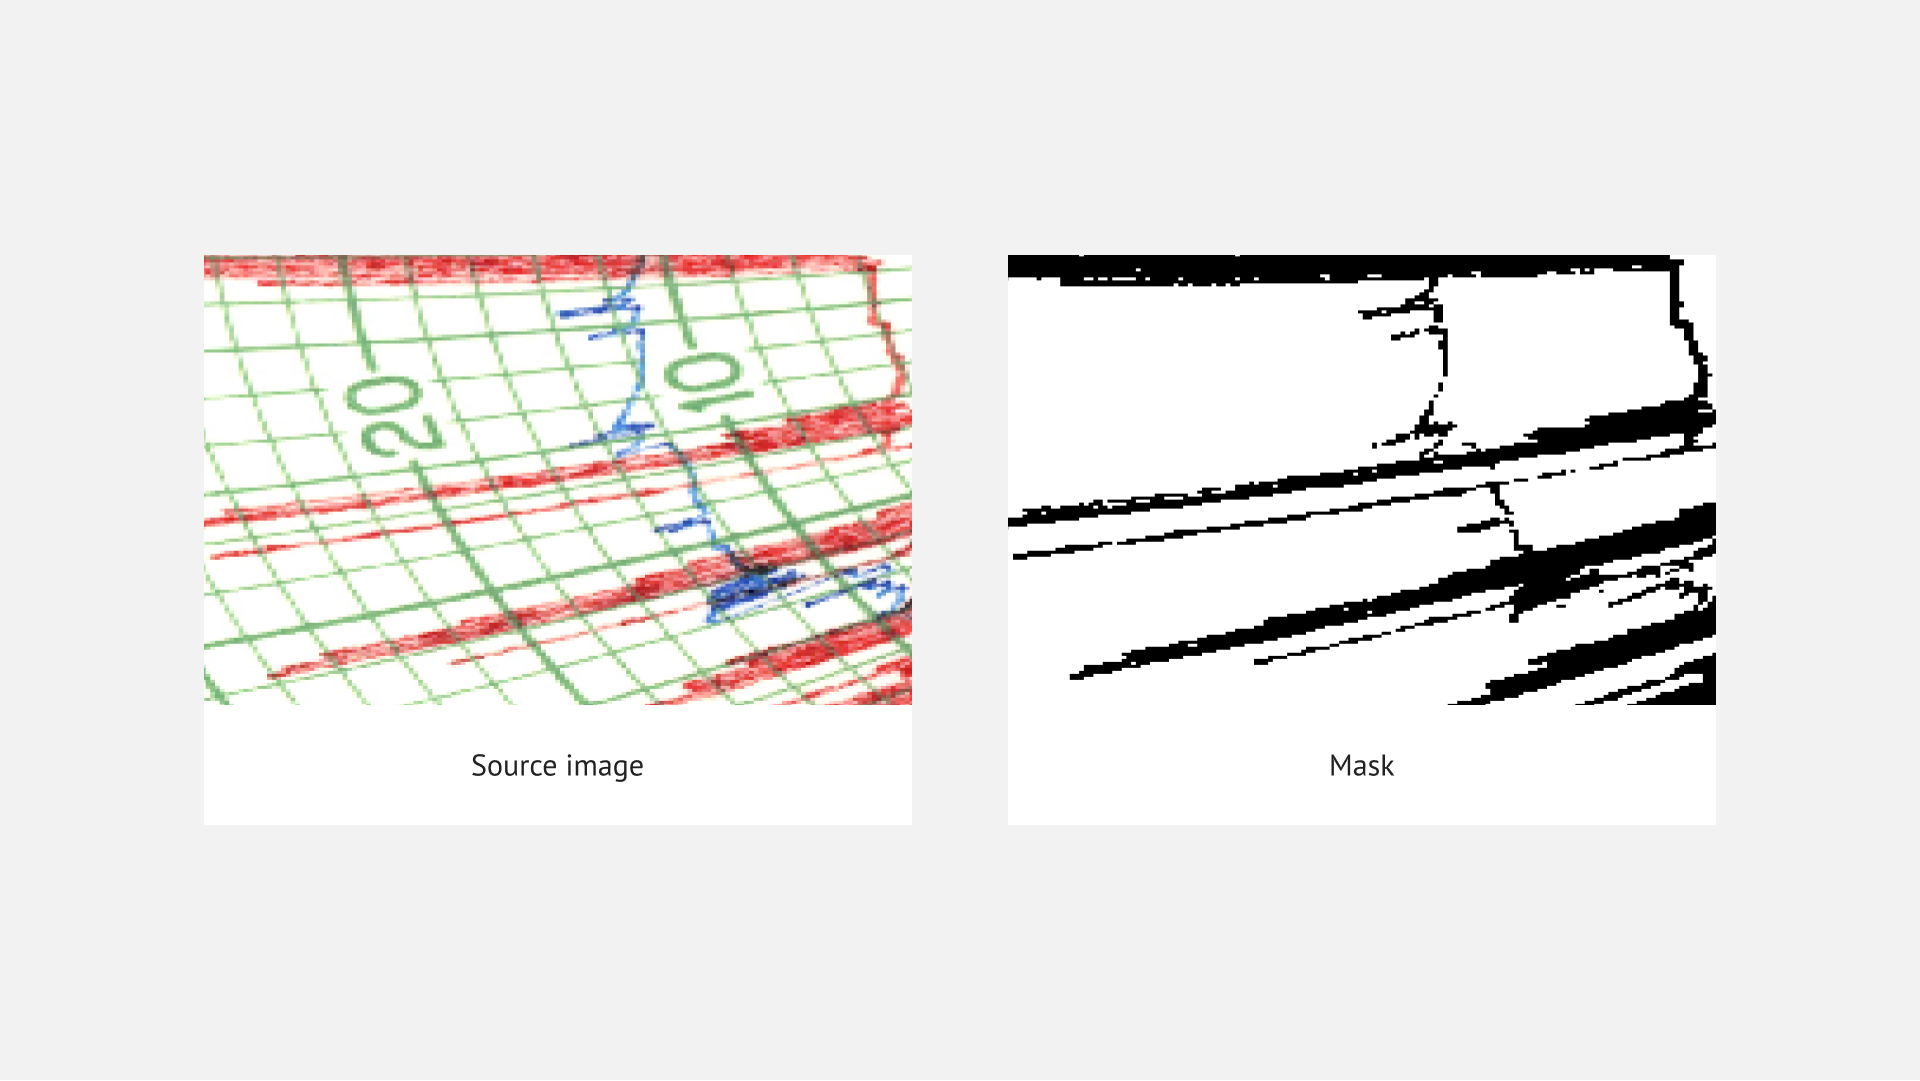
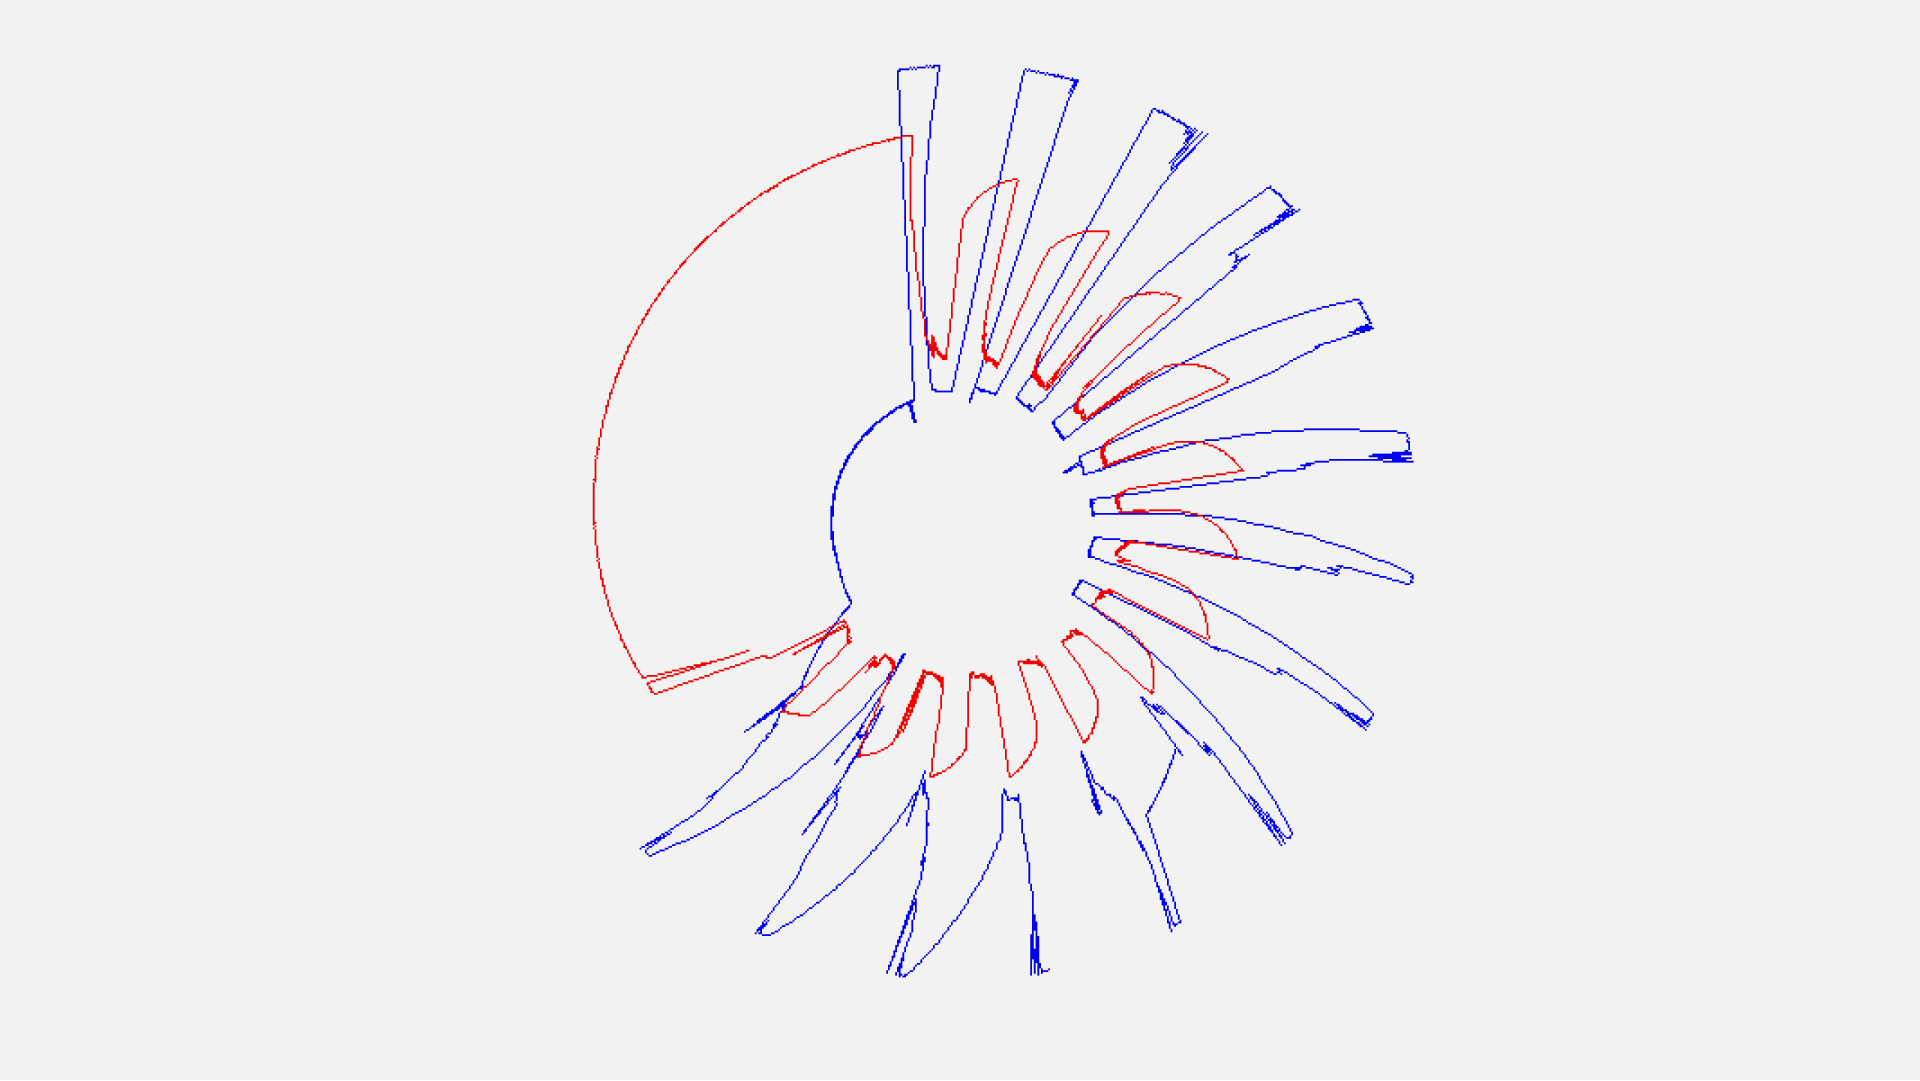
As a result of the first phase we developed the solution that takes the images of these charts input data, recognizes each trace and generates the result file as a table with the needed metrics of pressure, temperature, water.
This solution is currently used by the customer’s employees and provides them with a high level of accuracy. Now we are planning the second phase of development which is aimed to increase the current functionality.
External services integration (AWS S3, AWS Lambda) // Image rendering // Data mining // Image processing // Computer vision
NumPy // OpenCV // Tesseract